SOLAR ON THE CUSP PALO ALTO, CA - The photovoltaic industry is at the beginning of a painful change in the way incentives (driving force for the grid-connected application) are designed and administrated. Instead of generous feed in tariffs, the future likely holds tradable certificates and tenders (auctions) to set power purchase agreement (PPA) rates that will then be referred to as FiTs. Auction based incentive rates are the trend leading to margin declines for entities along the solar value chain from manufacturing to projects. Industries are made up of people reacting for market forces and pressures, and as such exhibit behaviors specific to these pressures. Reliance on incentives to drive demand has led to specific behaviors, including frantic buying when prices are low, and frantic installing into any available market. The industry continues to behave erratically, and can be difficult to size accurately. One reason for the sizing difficult are the different metrics that are available for measuring, and the lack of definition of what is being measured and how it is being measured. |
 Paula Mints, Director, Navigant (NYSE: NCI) |
||||
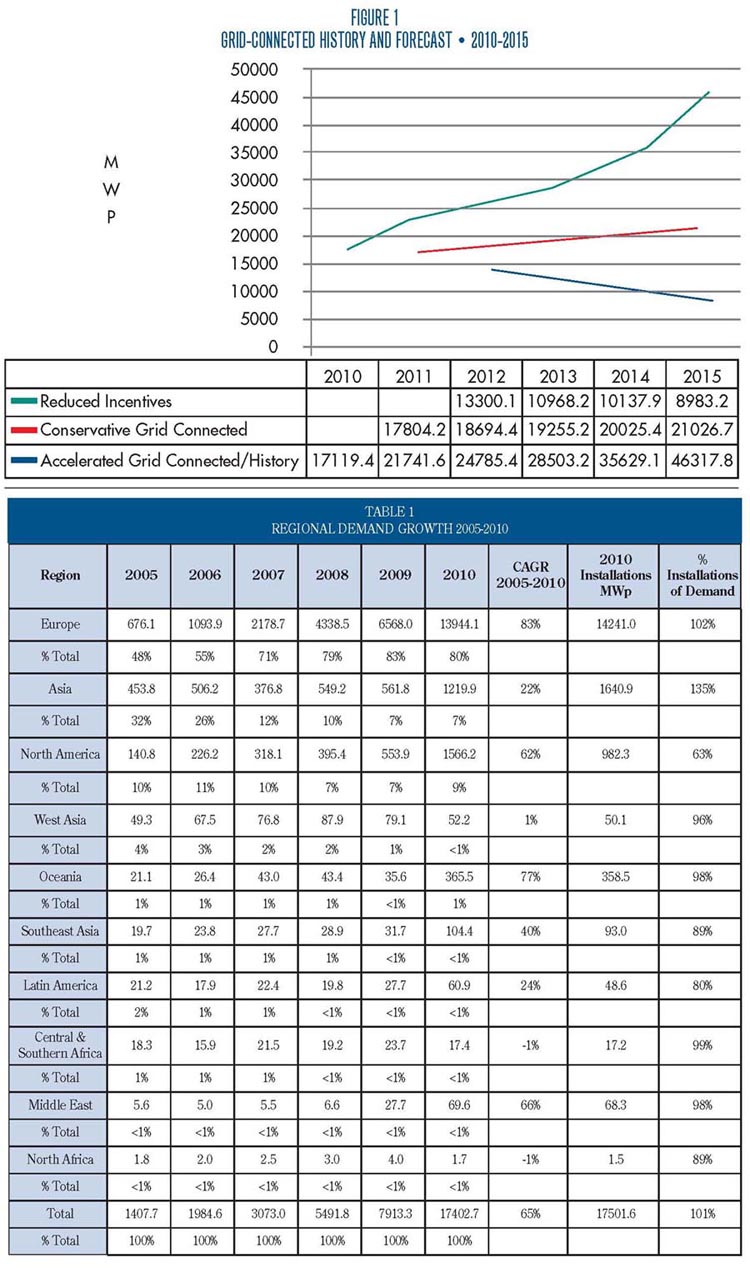
For example, in some cases industry size is defined by announcements of projects, or by non-transparent state or country databases, or, by installations, manufacturer capacity or shipments to the first point of sale in the market. In the 2005 through 2010 five-year period, shipments to the first point of sale in the market, increased by a compound annual growth rate (CAGR) of 65%. The first point of sale in the market can be an end user, a distributor, an installer or another manufacturer. Installations tend to lag demand, however, in recent years with growing levels of inventory on the demand side, installations have in some cases exceeded annual demand levels. In general, the calendar year begins with some level of inventory from the previous year. This excess inventory is then absorbed, typically. In the 2005 through 2010 five-year period, installations (for all applications) increased by a compound annual rate of 73%. In 2010 installations exceeded demand by 109.2-MWp, indicating that most of the inventory from 2009 was absorbed. During the end of 2010 there was significant buying, again leading to inventory, much of which was resold during the beginning of 2011. On an annual basis, accelerated growth in the photovoltaic industry continued in 2010 at 120% over the previous year, from 7.9-GWp to 17.4-GWp. In 2011, despite a flat first half, growth is expected from 4% (conservative) to 27% for the accelerated forecast. |
|||||
|
|||||

|
|||||
|
|||||